This paper focuses on the main characteristics of the US e-commerce market and the trading behavior of retailers under the macroeconomic background selects the TOP 2,000 companies with sales growth in this market and evaluates them from four aspects: product recommendation, social marketing model, payment service, and logistics service. Sort out the big dimensions to analyze how it stands out from the fierce competition.
1. Overview of the U.S. e-commerce market

As one of the world’s major e-commerce markets, the US is undoubtedly fertile ground for growing brands and retailers. According to World Bank data, the United States has a population of 334.7 million, of which 90% of residents use the Internet, and 74% of residents shop online.
Like other countries, the United States is recovering from the impact of the epidemic, during which time the US government has invested heavily in supporting the economy. Since then, the consumption power of residents has returned to normal levels. The Organization for Economic Co-operation and Development expects U.S. real GDP to grow by 18% in 2022, with growth projected at 0.5% in 2023 and around 1.0% in 2024. Meanwhile, U.S. inflation is 4.99%, above the long-run target of 2%. In a report on the U.S. market outlook, the OECD predicted that inflation would slash spending plans across the economy, which would further weaken wage growth. Price pressures have moderated somewhat as energy prices have stabilized and demand growth has slowed in line with the overall economic slowdown. Inflation is expected to remain high until 2024.
The United States has strong online consumption capabilities. According to Statista data, it is estimated that the online consumption of American consumers will reach 986.1 billion U.S. dollars in 2022, or about 3,700 U.S. dollars per capita. An online survey involving 500 American respondents showed that 46% of the respondents indicated that their weekly average online shopping spending was between US$12 and US$120, and 31% of the respondents indicated that their monthly average online shopping expenditure Amounts range from $120 to $300.
However, according to research by Retailx Consumer Observatory, although about 37% of consumers shop online once a week, and another 32% shop online once a month, people also prefer Go to an offline physical store. Statista analysis shows that among those who shop through various channels, 25% of consumers prefer to shop online, and 75% prefer to shop in physical stores. According to Digital Commerce 360, in the third quarter of 2022, 20.6% of retail sales in the United States will come from online channels. During the same period, total U.S. retail sales grew by 7.7%, while online channel retail sales increased by 10.8% and offline retail sales increased by 7%.
In the online shopping channel, orders originating from mobile devices do not seem to have as much advantage as in other national markets. Statistics from Statista show that 53% of online consumers in the U.S. prefer to shop on desktop, while 47% prefer to shop on mobile devices.
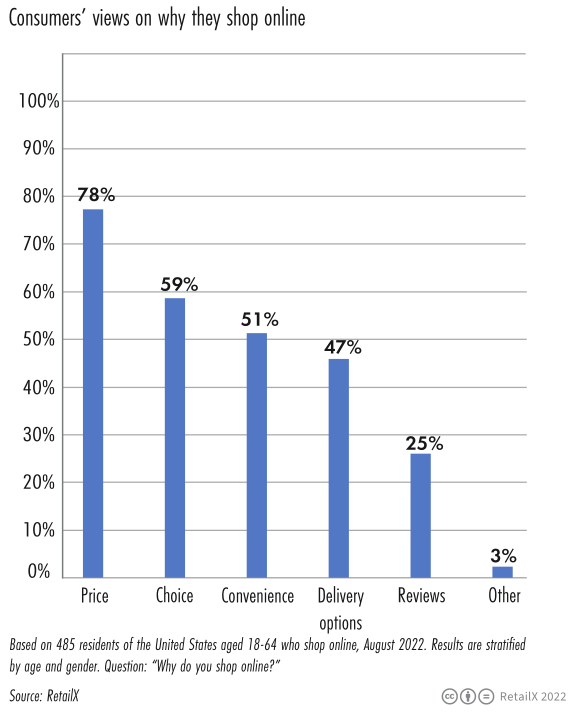
At the same time, 78% of the respondents believe that price is the primary reason for choosing online shopping. 59% of the respondents believed that the product selection of online channels is diversified, 51% of the respondents believed that online shopping brought convenience, and 47% of the respondents believed that the delivery method satisfied them.
According to RetailX data, American consumers prefer to buy fashion clothing or accessories online (54%), followed by books (39%) and consumer electronics (38%).
At the same time, Statista’s data shows that bank cards are the most commonly used payment method for online shopping (37%), and more and more people pay through e-wallets (24%). McKinsey research shows that more than 90% of American consumers expect to receive free shipping within two to three days after placing an order, and 20% of consumers are willing to pay more for faster delivery.
Over time, Statista data shows that young consumers are more inclined to use social media for shopping inspiration when buying holiday gifts such as Black Friday, Thanksgiving, and Christmas. This situation is especially seen in Generation Z (84%) and These two groups are millennials (81%).
According to Google data, compared with 2021, the search volume of the term best affordable has increased by 60% year-on-year. As inflation and supply chain pressure continue to intensify, consumers have become more cautious in their consumption mentality, and their shopping frequency has gradually decreased.
In 2023, retailers may face a more difficult environment. Merchants usually keep a low profile and strengthen their market positions during times of economic uncertainty, but in this case, the opposite was true for online sellers.
2. Data Analysis of TOP 2000 Retailers
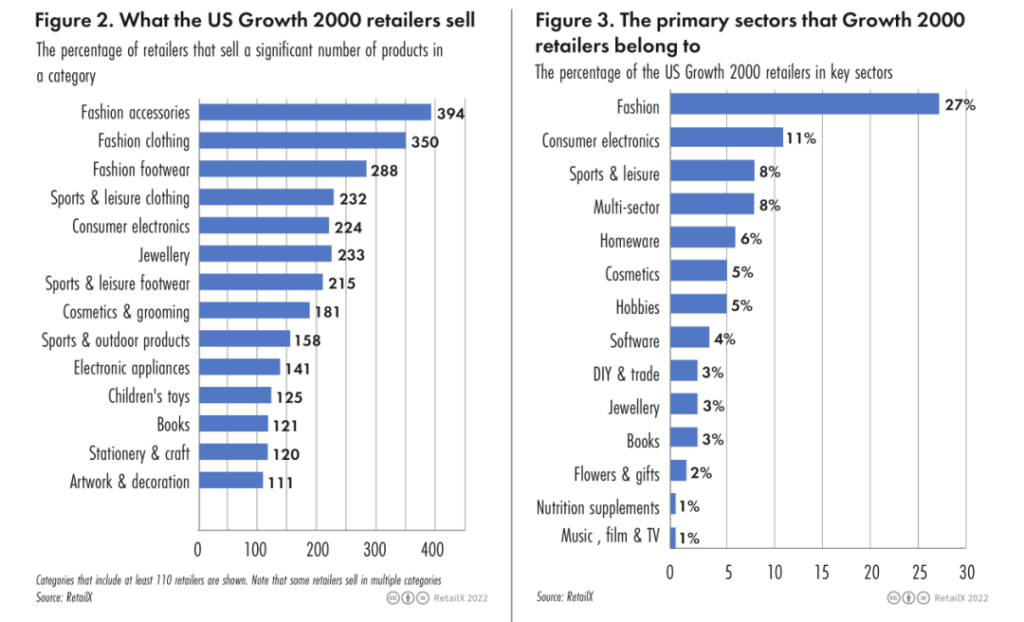
Among the TOP 2000 retailers, the top 5 main sales categories are:
• Fashion accessories (394)
• Fashion clothing (390)
• Fashion footwear (288)
• Sports and leisure clothing (232 companies)
• Consumer Electronics (242 companies)
Among the TOP 2000 retailers, the proportions of the top five fields are:
• Fashion (27%)
• Consumer Electronics (11%)
• Athletic and leisure (8%)
• Multi-domain products (8%)
• Household Goods (6%)
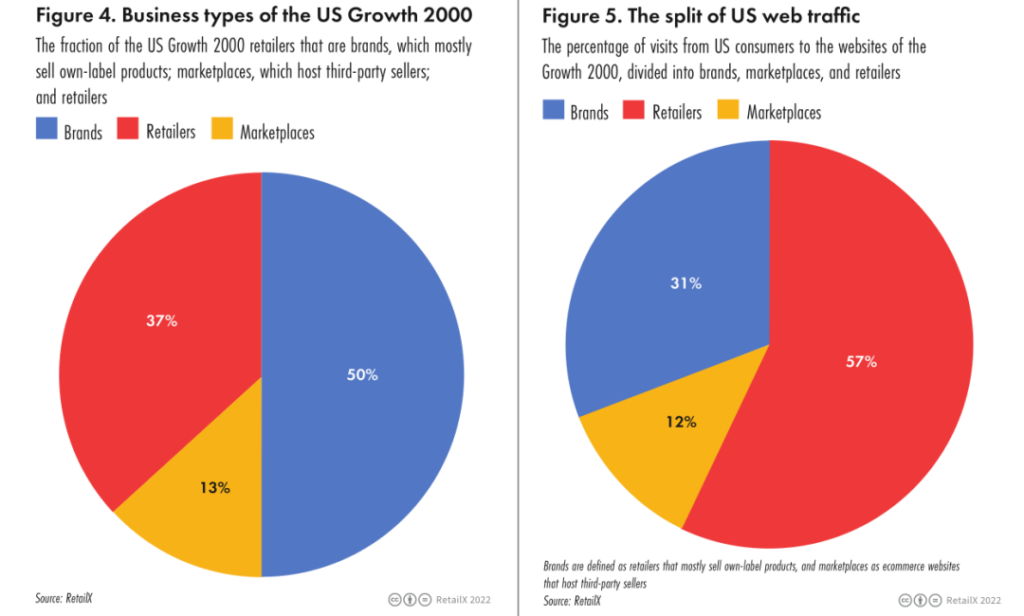
About half of the sampled US TOP 2000 growing companies are private labels, 37% are retailers, and 13% are e-commerce platforms. Retailers (57%) are sitting on more than half of the market traffic, followed by brands (31%) and e-commerce platforms (12%).
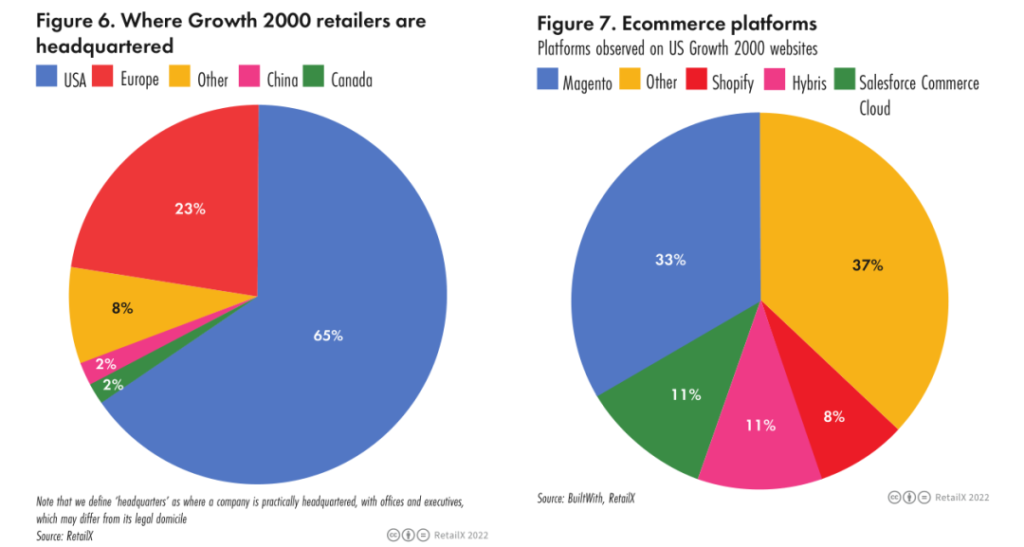
Among the TOP 2000 retailers in the United States, the distribution of merchants in each region is as follows: the United States (65%), Europe (23%), others (8%), China and Canada (2% respectively).
3. Analysis of key dimensions of retail industry
a. Product recommendation
Allowing consumers to easily search for their favorite things is undoubtedly the first step to start a successful business.
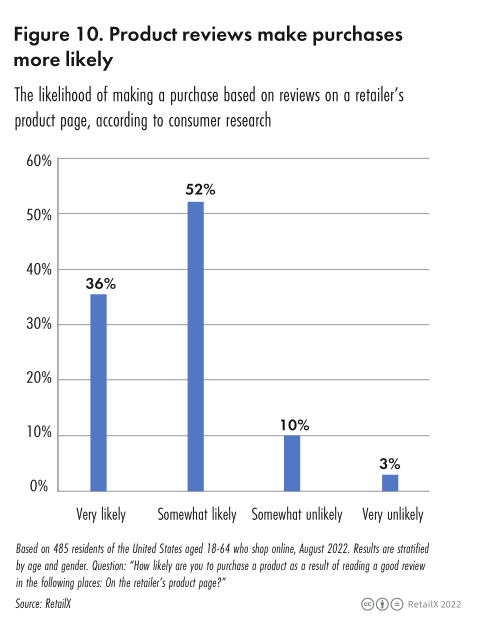
According to the 2022 RetailX consumer research data, searching for a wider range of products is the main reason for 52.8% of American consumers to choose online channels, second only to convenience (79.8%) and price (61.0%). Product recommendations are also a key reason why 24.3% of consumers made it onto a retailer’s loyal customer list. Product reviews (36%) are another important factor for consumers to choose online channels.
RetailX researchers first evaluate the merchant’s product recommendation performance through the ease of browsing the website and the attractiveness of the website to consumers. Whether consumers can save products through the website for later use or share with friends and other factors are all factors. It may affect the future sales of merchants.
Consumers can get word-of-mouth recommendations from relatives and friends, or share products via email or social media to recommend products to other relatives and friends. 37% of retailers allow consumers to share product discoveries with friends via social media such as WhatsApp or Twitter.
40% of retailers believe that it would be beneficial for consumers to have a wish list on the website that consumers can save, and 39% of brands agree with this point of view and put it into action. However, consumer electronics retailers don’t tend to offer wish lists.
Recommending like-for-like product recommendations is also a strategy worth considering, with 35% of retailers offering product recommendations on their website.
The most likely to make product recommendations are fashion retailers (44%), followed by brands (38%) and consumer electronics retailers (23%).
b. Social media marketing
In recent years, social commerce in the United States has developed rapidly. RetailX analyzed and investigated the social media marketing of retailers and brands.
Many retailers and brands have used channels such as Facebook, Instagram, and Twitter to engage in dialogue with consumers around products and user experiences, thereby significantly increasing brand and product awareness.
RetailX research found that Facebook is the social media channel that American consumers are most likely to click on product advertisements. 45% of American respondents also indicated that they are willing to click on advertisements that enter this channel. The click status of respondents on other social media channels is as follows:
• Google search results ads (47%)
• YouTube Ads (40%)
• Instagram Ads (33%)
• Pinterest ads (19%)
In terms of time span, consumers purchase products through social media ads as follows:
• Annually (25%)
• Daily (13%)
• Weekly (22%)
• Monthly (20%)
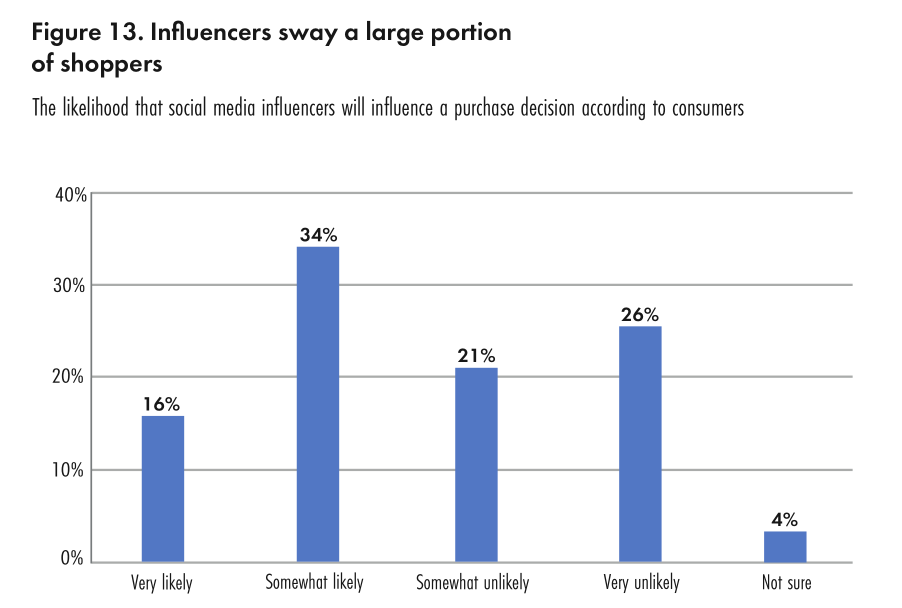
The RetailX Consumer Insights study also found that about 50% of online U.S. consumers said they would be very likely (16%) or somewhat likely (34%) to listen to social media bloggers when deciding what to buy. Meanwhile, 30% of consumers say they look to social media ads, and 25% of US consumers use social media channels for their searches when searching for deals and rewards.
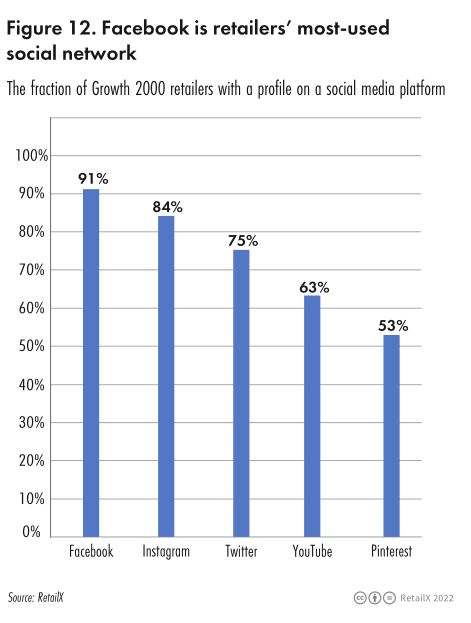
The social media channels used by the TOP 2000 retailers are as follows:
• Facebook (91%)
• Instagram (84%)
• Least likely to use Snapchat (1%)
• Twitter (75%)
• YouTube (63%)
• Pinterest (53%)
The fashion category was the largest single retail category in growth in the US. According to RetailX consumer data, 54% of U.S. consumers shop for fashion products over the Internet.
The social media usage of fashion retailers is as follows:
• Facebook (96%)
• Instagram (97%)
• Twitter (80%)
• YouTube (62%)
• Pinterest (59%)
c. Logistics service
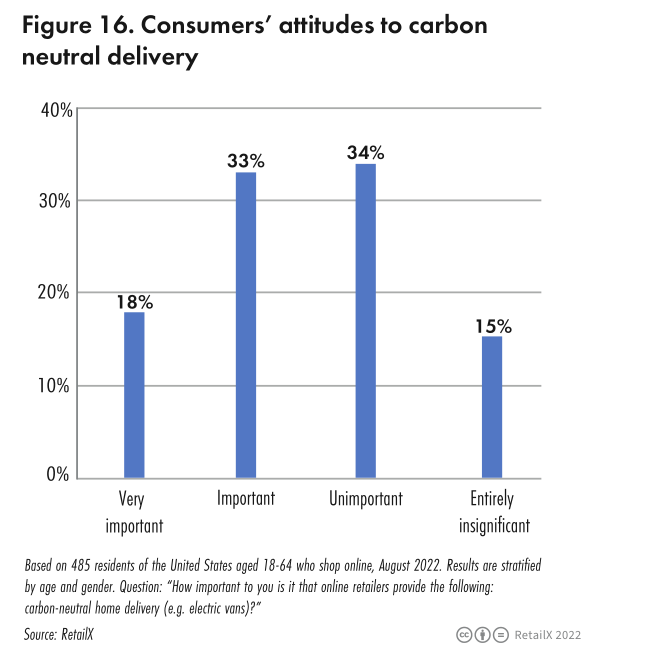
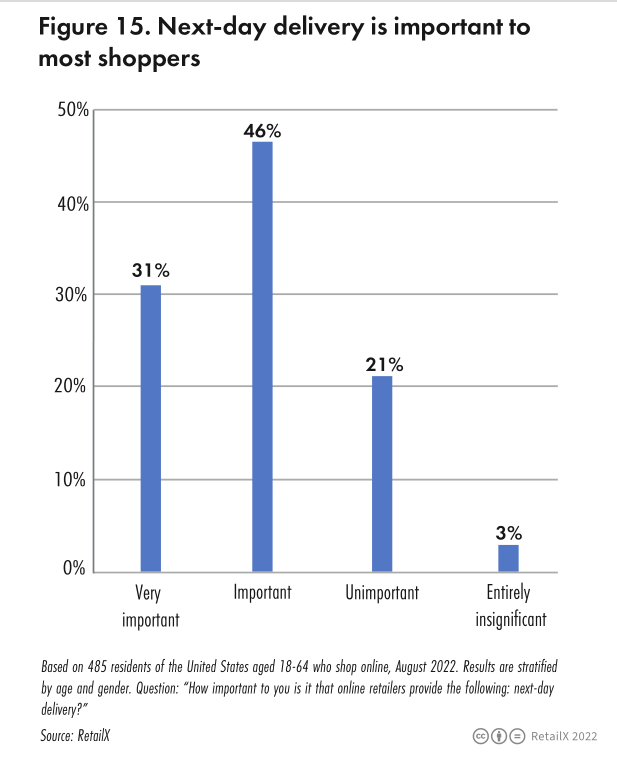
Research by RetailX Consumer Observatory in the U.S. market shows that 50% of the respondents think the delivery method is very important; 78.6% of the respondents said that online retailers provide next-day delivery service, which is very important to them or very important; 73.2% of the respondents said that same-day delivery service and green home delivery service are equally important.
Research by Retailx found that when consumers decide to buy a new product, lower shipping costs (or even free) are the key decision-making decision, and better delivery service options come in second.
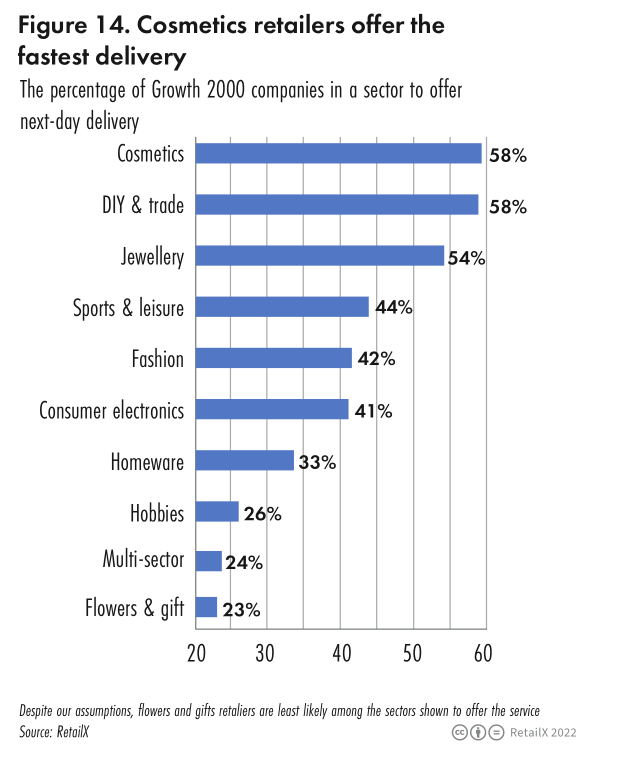
The categories and proportions of retailers offering next-day delivery services are as follows:
• Cosmetics (58%)
• Jewelry (54%)
• Athleisure apparel and equipment (44%)
• Fashion (42%)
• Consumer Electronics (41%)
• Household Goods (33%)
• Hobbies (26%)
• Multi-category retailers (24%)
Retailers that offer same-day delivery:
• Household Goods (83%)
• Multi-category retailers (81%)
• Jewelry, hobbies (both less than 1%)
• Fashion (11%)
• Consumer Electronics (1.5%)
• Sports and leisure (1.8%)
At the same time, inventory status can often help consumers make purchasing decisions. The RetailX study found that 42% of multi-channel consumer electronics retailers are most likely to display inventory availability through their website, followed by multi-channel fashion retailers (31%).