Italy is one of the first European countries to be “snap” by the epidemic. According to the release of the Bank of Italy, the Italian economy was hit hard by the epidemic in 2020, but it will recover in 2021 with the recovery of residents’ disposable income and consumer confidence, and in 2022. In 2018, the outbreak of geopolitical conflicts disrupted the recovery plan of the financial market. 40% of Italy’s natural gas supply came from Russia. After the outbreak of the conflict, the Italian government had to seek alternative energy sources, and the extra cost can be imagined.
In 2020, due to the impact of the epidemic, total Italian consumer spending fell by 10.6%, and rose by 5.2% in 2021, but declined in the last quarter of 2021, by 0.1%; GDP also increased in the first quarter of 2022. After a sharp decline in 2020 (-9%), it rose in 2021 (+6.6%). The Italian government said it was conservative on the recovery of the consumer market, forecasting growth of 2.4% in 2023, lower than the forecast of 2.8%; average wages fell from 29,828 euros in 2019 to 27,997 euros in 2020.
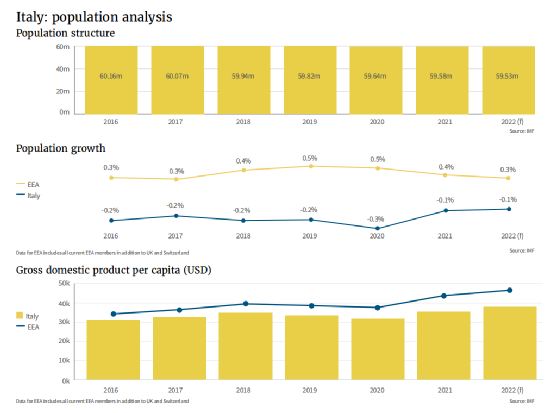
At present, the population of Italy is 59.5 million, and it will continue to decline in the future. The proportion of the population aged 65 and over is increasing (accounting for 23% of the total population in 2020), and the proportion of the population aged 14 and below is declining (accounting for 2020 13% of the total population), the aging situation is not optimistic. In 2021, Italy’s birth rate will drop below an all-time high of 400,000. In the same year, Italy’s total number of deaths due to the epidemic ranks eighth in the world.
Italian e-commerce market
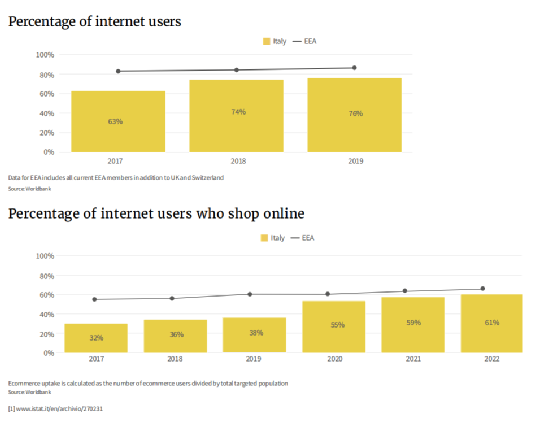
In terms of internet penetration, Italy is below the EEA average. According to the World Bank, Internet penetration in Italy was 76% in 2019 (the EEA average for the same period was 86%), an increase from 63% in 2017. During the epidemic, the Internet penetration rate and online shopping rate both increased, the latter rising from 38% in 2019 to 55% in 2020, and then to 59% in 2021, and is expected to reach 62% in 2022.
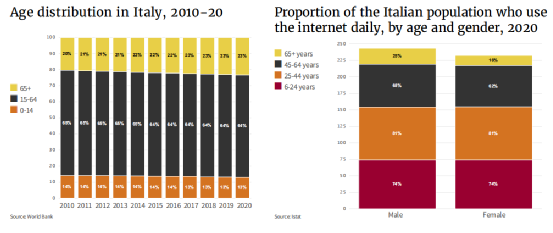
According to data from Statista, 74% and 81% of Italian respondents under the age of 24 and 25 to 44 said they used online shopping as a consumption method, and there was no obvious gender difference, while the respondents over the age of 65 The gender gap in China is magnified, with 25% of men shopping online, while only 16% of women.
In March 2022, total retail sales in Italy increased for 13 consecutive months compared to the same period last year, and while total retail sales increased overall compared to 2021, online shopping fell by 3.9%, according to Istat. %. Sales increased in all categories except Computers and Telecommunications Equipment (-0.5%), with Leather Goods and Travel Goods (+24.6%), Furniture, Textiles and Household Goods (+20.9%) and Apparel (+20.5%) %).
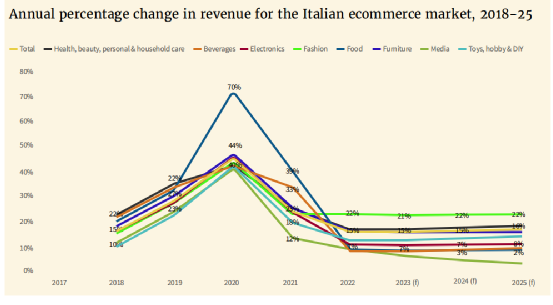
According to Statista data, Italian e-commerce transaction volume has been on the rise before the epidemic, with an increase of 27.2% in 2019, a surge of 43.8% in 2020 due to the epidemic, and a fall back to 14.7% in 2021. It is expected to maintain growth until 2025. The positive stimulus effect of the epidemic on categories such as food (+70% in 2020, +39% in 2021), toys (+40.5% in 2020) and furniture (+45% in 2020) is more obvious.
Spotlight on local Italian trends
- Consumption habits
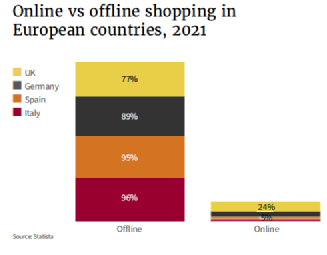
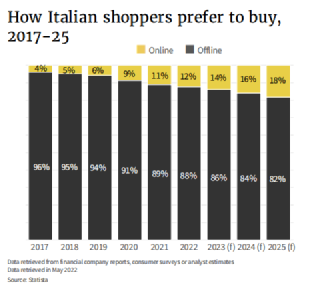
Compared with some Nordic countries, Italians are more willing to spend offline. According to statistics from Statista, the proportion of online and offline consumption in Italy in 2021 will be 4% and 96% respectively. Statista’s analysis of shopping style preferences shows that the region’s e-commerce market has plenty of room to grow.
As can be seen from the figure below, since 2020, the willingness of Italian consumers to shop online has shown an upward trend year by year. It is estimated that by 2025, the online shopping rate of Italian consumers will reach 18%, and 82% will still choose to buy in offline supermarkets or stores. Analysts say retailers with multi-channel business models and convenience services could benefit from this change in user behavior.

In Italy, computer-side online shopping is still very popular. In 2017, the proportion of mobile and computer-side online shopping was 29% and 71% respectively. As time goes by, the gap between the two is gradually narrowing. Data shows that more and more people will shop online through smartphones or other mobile devices. According to Statista, the proportion of online shopping on mobile in Italy will rise to 39% in 2021 and is expected to reach 41% by 2024. Additionally, Statista predicts that by 2025, 70% of consumers will own a smartphone.
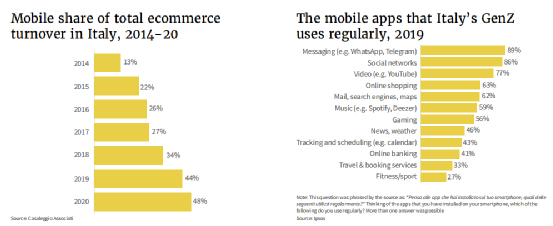
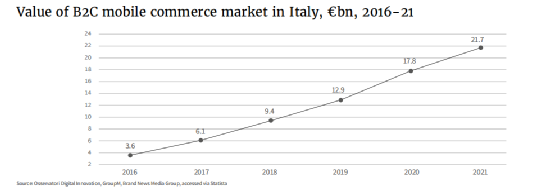
Analysis by Casaleggio Associati shows that the proportion of online shopping on mobile devices has risen significantly. In 2014, mobile e-commerce sales accounted for 13%, and in 2020, this proportion rose to 48%. The market value of mobile commerce is also on the rise – from €3.6 billion in 2016 to €17.8 billion in 2020 and €21.7 billion in 2021. This shows that Italians are increasingly interested in mobile online shopping. Statista pointed out that the 25-34 age group of respondents made the highest proportion of online shopping on the mobile terminal, reaching 77%.
- Social media e-commerce
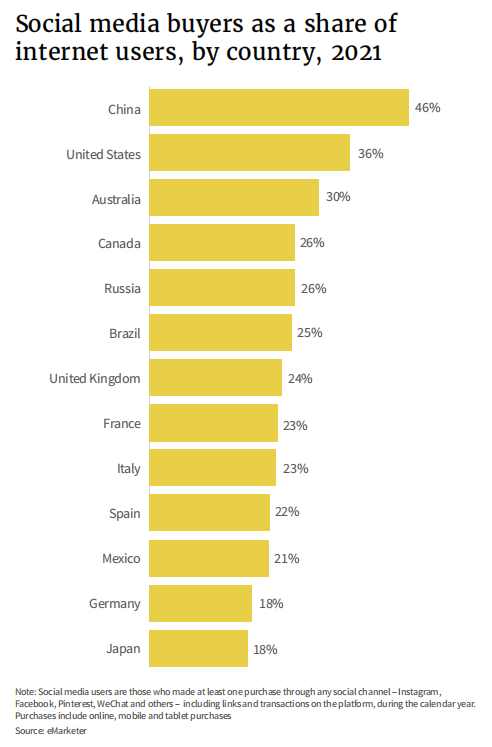
According to eMarketer, 23% of Italian netizens shop online through social media channels such as Instagram, Facebook or Pinterest, second only to the UK at 24%. Social media shopping is even lower in Spain and Germany, at 22% and 18%, respectively. However, social media e-commerce usage in all European countries lags far behind China and the United States.
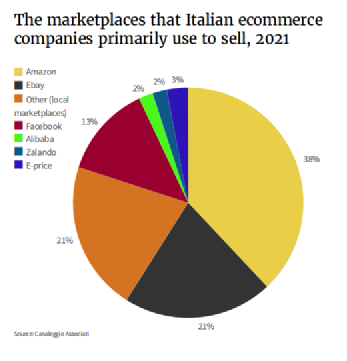
According to data from Casaleggio Associati, in 2021, 13% of companies will choose Facebook as an e-commerce trading platform. As mentioned earlier, Generation Z is the main driving force for the development of Italian social media e-commerce. Amazon (38%), eBay (21%) and other local platforms (21%) are the choices for most businesses.
- Silver economy
Older shoppers make up a higher percentage of the total population in Italy than in Europe as a whole. World Bank figures show that the share of Italy’s population over the age of 65 has been rising steadily over the past decade, from 20 percent in 2010 to 23 percent in 2020. In 2021, the European population over the age of 65 will account for 19.1% of the total population. At the same time, the proportion of young Italians is also slowly declining, from 14% in 2010 to 13% in 2020 (15.5% in Europe over the same period). Under the trend of an aging population, e-commerce companies or retail companies need to pay more attention to the needs of the elderly.
In Italy, 65 percent of respondents aged 45 to 64 were male and 62 percent were female, according to Istat. Among respondents aged 65 and over, the proportions were 25% and 16%, respectively. Elderly Italians seem to be more receptive to e-commerce than the UK and Germany. Judging by purchases from Amazon. 96% of Italian netizens aged 50 to 65 use Amazon, and 94% of netizens aged 65 to 79 are higher than the respondents in the UK and Germany in the same age group.

- Payment method
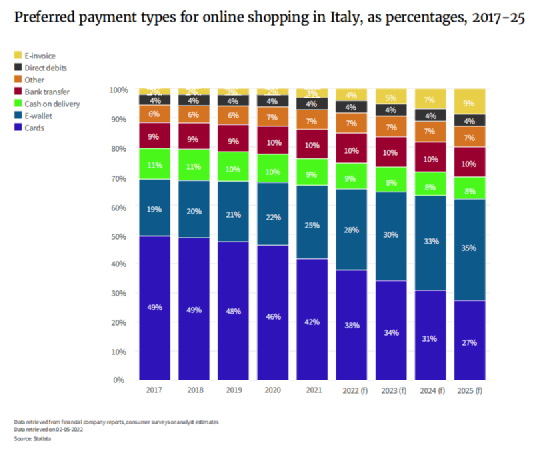
According to Statista, more convenient means of payment, such as e-wallets, are starting to gain popularity in Italy. In 2017, 49% of consumers made purchases with a card. Since then, this proportion has declined and is expected to drop further to 27% by 2025; in 2017, the proportion of using electronic wallets was only 19%, and it will increase to 25% and is expected to reach 35% by 2025. The popularity of smartphones is an important reason for the rise in e-wallet usage.
- Online shopping returns
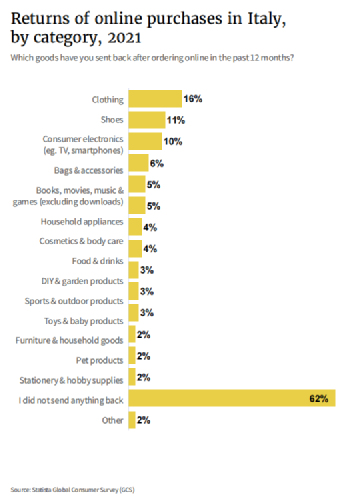
The current return rate for online shopping in Italy remains at a low level. In a 2021 Statista study, 63% of respondents said they had not returned a product purchased online in the past year. Categories with higher returns are apparel (16%), footwear (11%) and electronics (10%). At the same time, the categories that consumers are most likely to buy online include electronic products, accounting for 44%, and the online shopping rate of clothing accounts for 31%. Categories with particularly low return rates include household goods, pet products, and stationery, all at 2%.
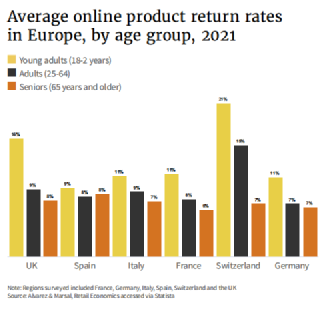
In the study by Alvarez & Marsal/Retail Economics, young consumers had the highest return rates of the six European consumer markets surveyed. Research shows that the return rate for online shopping among Italians aged 18-24 is 11%, 9% for those aged 25-64, and 7% for those over 65. It is worth noting that the penetration rate of online shopping is often proportional to the return rate, and returns will become an unavoidable cost over time. Like the rest of the EU, Italian consumers have at least 14 days to return products purchased online. EU law also stipulates a two-year free warranty period, regardless of the purchase channel, giving consumers enough life cycle to return the faulty product.
- Consumer goods
Fashion and electronics are the two most popular online shopping categories in Italy. According to Statista, Italians will spend an average of about 554.79 euros in online shopping for fashion in 2021, and this figure is expected to rise to 936.43 euros in 2025; the average online purchase of electronic products is about 392.50 euros, which is expected to rise by 2025. to about 429 euros.
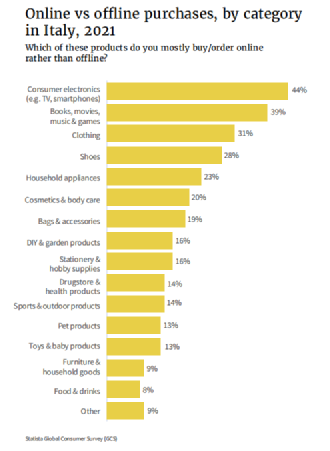
When asked “Which categories are more willing to buy online than brick-and-mortar stores”, 44% of the respondents chose electronic products including mobile phones and TVs, and books & movies & music & games accounted for 39%. Clothing and footwear accounted for 31% and 28% respectively. Currently, fewer Italian consumers are prioritizing online grocery shopping (8%), furniture, and household items.
Statista also found that 68% of people look for information online before buying electronics, while 51% say they do so before buying home appliances. However, when it comes to buying books, movies, music, clothing, shoes and other categories, the proportion of “doing homework” is smaller at 37%.
According to the 2021 Statista Global Consumer Survey, the reasons Italians may prefer to buy these categories online are mainly for value for money (64%) and home delivery (60%).
- Holiday shopping
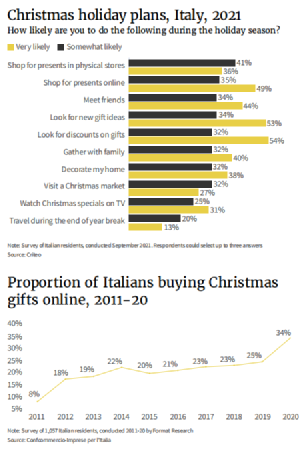
According to 2020 McKinsey data, more than half (51%) of Italians are likely to shop during the holidays. This ratio is higher than in the UK and US, but lower than in France, Germany and Japan. A study by Format Research for Confcommercio-Imprese per l’Italia shows that Italians are increasingly shopping online. After the outbreak of the epidemic in 2020, the online shopping rate on holidays has further increased.
- Retailers
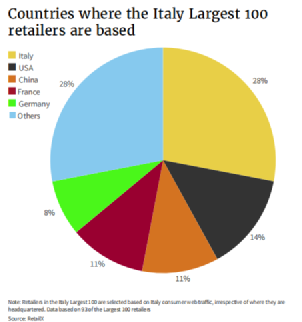
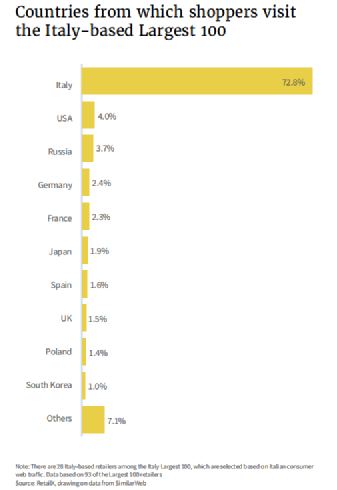
The RetailX study found that 28 of the top 100 retailers are headquartered in Italy, and U.S. retail companies have a large market share in Italy, with headquarters in China (11%), France (11%) and Germany (8%). of retail companies also have a strong presence in the Italian e-commerce market.
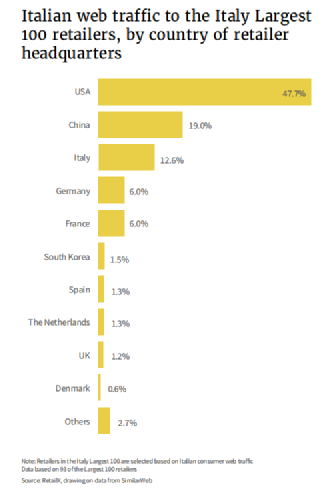
In terms of the traffic distribution of the top 100 retailers in Italy, retailers headquartered in the United States accounted for the largest share of traffic at 47.7%. Chinese online shopping platforms have a larger traffic share (19%) than Italian online shopping platforms. Site traffic was lower in Germany and France (both 6%), with smaller shares in South Korea (1.5%), Spain (1.3%), the Netherlands (1.3%) and the UK (1.2%).
